Local Government Reorganisation: What Councils Inherit on Day one
Local Government Reorganisation is often discussed in terms of boundaries and governance.



Crafting Clarity in a
World of Complexity

Learn more about
Camdor Global Advisors

On 29 April the Pension Schemes Bill received Royal Assent and became law. It brings to a close a policy initiative which started in late 2024 with Chancellor Reeves’ first Mansion House speech.
According to the Government, this is a landmark bill, which will help more than 20 million people better save for their retirement and will boost UK growth. It aims to achieve that by reducing costs and boosting returns. It will also make it easier to consolidate smaller individual pension pots and allow the creation of multi-employer defined-contribution ‘megafunds’. Importantly, after much back and forth with the House of Lords, the Government agreed to tone down its original plans. These would have given it the power to mandate UK pension schemes to invest in private markets, half of this investment being in the UK.
It is good to see these proposed powers watered down. While we can see why the Government might want to steer pension investment to what it might consider to be “good causes”, it really should be for the schemes themselves to decide what is best for their members.
The Bill also put the finishing touches to the consolidation of the Local Government Pension Scheme into a few pools, which the government hopes will lead to economies of scale and generally better outcomes. This consolidation is nearly complete now, with pools already doing most of what they are expected to do. But as local authorities move from trusted and established arrangements involving appointed fund managers and independent advisors to new arrangements centred around powerful pools, they need to remain extra vigilant. Governance issues may emerge as the relationships between stakeholders change.






Camdor Global Advisors evaluates accuracy, depth and strategic insight
AI adoption is accelerating. Decision makers, researchers and policy professionals increasingly use AI-generated output to drive strategic assessments, policy advice and investment discussions. The question is no longer what AI can do, but how much we can trust it. AI adopters should be cautious and consider the risks regarding accuracy, credibility and reliability. While we acknowledge AI significantly accelerates research, it has not removed the need for human oversight.
At a high level, we note that AI excels at speed, structure and coverage, but falls short on policy alignment and judgement. Additionally, a few of the models can reach near-human reasoning through multi-step prompting, but continue to produce hallucinated references and generic outputs. The UK’s competition regulator and other authorities flag hallucination/unreliability as known risks – demonstrating that AI still fails to address regulatory concerns.
Camdor Global Advisor’s (CGA) Test :
We designed a test to evaluate AI-generated outputs against human analysts’ prompt responses using three criteria: Factual Accuracy, Analytical Depth and Policy & Strategic Insight.
Prompt topics:
We employed distinct prompts to make our experiment robust, while testing the AI models’ ability to extract data accurately and provide analytical insights.
Samples From Our Testing
Prompt 1: Historical local authority capex data: Testing Factual Accuracy
What AI did and responded with:
Several AI models extracted £25.9bn from the Department for Levelling Up, Housing and Communities (DLUHC) 2018-19 outturn report for the FY2018-19 figure and then applied a GDP inflator (a few hallucinated the inflation level to apply) to arrive at a standardised 2022-23 price. The models failed to notice that DLUHC in their 2022-23 report published the real term figure of £29.6bn. The models needlessly introduced complexity and arrived at an incorrect figure, demonstrating inconsistency.
Risk summary: Even with a precise and well-framed prompt, AI models selected an outdated price base and generated inaccurate comparisons. This highlights an issue with data retrieval and inflation-adjustment logic.
VS
What a human analyst would respond with:
An analyst would accurately identify the correct DLUHC dataset, verify the price base, and correctly cite £29.6bn (real, 2022-23 prices) for 2018-19 and £27.5bn for 2022-23. They also clarified that the £25.9bn remains valid only in 2018-19 prices, adding transparency and eliminating ambiguity.
Stakeholders should be aware that hallucinations and other errors are not isolated incidents. A recent example was highlighted by the Guardian where a company used AI to produce a report for a local Australian government containing errors and hallucinated references to non-existent sources.
Prompt 2: Local authorities investing responsibly: Testing Analytical Depth
What AI did and responded with:
The response is partially surface level, remaining very general. It is not fully tailored to local authorities or pension funds, presenting strategies in a mainly institutional context rather than addressing the specific audience. While it does offer strategies and practical steps, it requires significant prompting to produce a response approaching the depth and relevance of a human analysis.
Risk summary: AI struggles to tailor analysis to specific audiences and can ignore key principles.
VS
What a human analyst would respond with:
A human analyst would refer to key policies such as LGPS Frameworks, Task Force on Climate-related Financial Disclosures (TCFD) and the UN’s six PRI principles etc. They would analyse how each can be applied to real-world scenarios associated with local authorities and pension funds. Drawing on experience with clients, a human can tailor the analysis to specific contexts, adding valuable insights that enhance understanding. Human insight provides additional depth and practical relevance, resulting in analytical reasoning that is more comprehensive.
A recent example reiterates our findings. CNET published AI-generated articles on topics such as personal finance, but many of these pieces were later found to contain numerous factual and analytical errors.
Prompt 3: Responsible Investment policy frameworks: Testing Policy & Strategic Insight
What AI did and responded with:
When prompted to explain financing mechanisms for UK local authority climate projects, several AI models, particularly Copilot and Perplexity, confidently stated that “local councils can issue sovereign green bonds to fund energy-efficiency projects” or cited the EU Green Bond Standard as the relevant framework. Both claims are incorrect in the UK context.
Risk summary: The output showed limited awareness of UK’s financing architecture and local borrowing limits, underscoring the risk of over-relying on unverified AI in policy advice.
VS
What a human analyst would respond with:
An analyst would recognise that Councils can finance capital via PWLB and the UK Municipal Bonds Agency, as per the Local Government Act 2003 and CIPFA Prudential Code and not by issuing sovereign debt. Additionally, the analyst would propose i) place-based climate infrastructure debt; ii) green municipal or UK municipal-style bonds; iii) retrofit outcome partnerships based on the client’s requirements. The response would demonstrate nuanced understanding of fiscal limits, policy coherence and implementation pathways – ensuring the recommendations are both legally compliant and investment-ready.
CGA’s Experiment Conclusion
We clearly find that AI excels at speed, structure and breadth, producing solid first-pass insight and analysis. A positive example of this efficiency benefit is indicated in Visual capitalist, allowing professionals to focus more on analysis and decision-making rather than routine work. However, AI models continue to be plagued by hallucinated sources, contextual gaps, factual inaccuracy and other errors. If purely AI generated reports or highly AI dependent opinions were presented to councillors/local government officers, it could potentially lead to incorrect decision-making, non-compliant financial strategies or reputational risks.
Human analysts will produce accurate, nuanced and contextually grounded outputs by applying their experience/expertise in institutional and policy awareness that AI still lacks. These qualities remain indispensable when precision, accountability and policy alignment underpin credibility.
At Camdor Global Advisors (CGA), we recognise these challenges and address them through extensive research and expert analysis. We also acknowledge that AI is improving, so these limitations found in the experiment may gradually be mitigated over time.
Implications for Firms
AI tools are invaluable for drafting, summarising and early-stage research, but their insights must be reviewed, verified and contextualised by human experts. At CGA, we view AI as a strategic augmentation tool, not an autonomous analyst. The combination of human judgment and AI efficiency offers the most credible and compliant path forward for regulated and advisory environments. Many AI solution providers frame automation as a path to cost reduction. Yet what is gained in speed is often lost in accuracy, context and accountability. At CGA, we view such shortcuts as false economies. Precision, policy alignment and informed judgment cannot currently be automated, they require expertise. For investors and public institutions, the path forward lies not in replacing human expertise but in integrating AI responsibly, as a tool for research and insight generation, supported by human validation.
*Note: This experiment was conducted in late 2025. Given the rapid pace of AI development, some findings may not fully reflect the capabilities of newer models. A follow-up experiment will be conducted in the future to reassess results against updated models.


Key Takeaways
The population of England is growing and ageing
In mid-2021 the resident population in England was 56.5m, up from 53.1m in mid-2011 (+6.6%). There were marginally more women than men (51% vs 49%), while the median age was 40.5 years, up from 39.4 years a decade earlier.
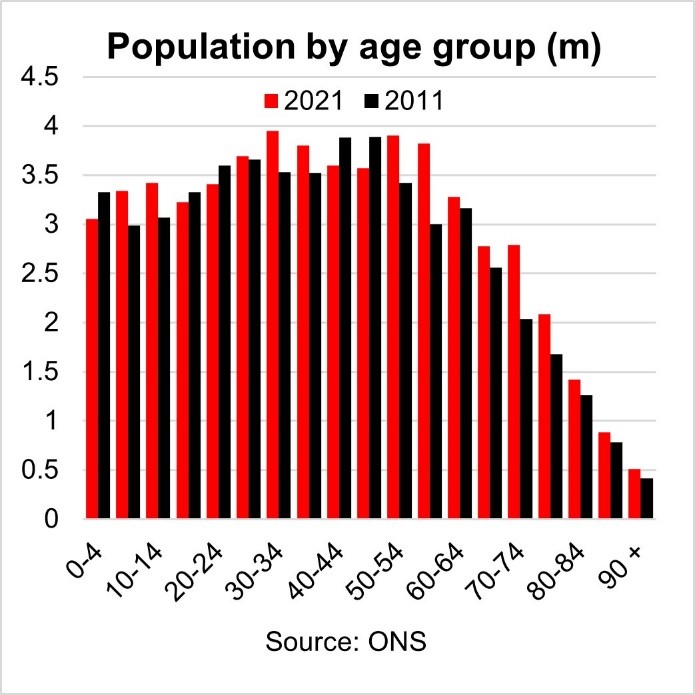
Between mid-2011 and mid-2022 the number of people aged 0 to 19 years increased by 2.6%, that of people aged 20 to 64 years (commonly defined as ‘the working age’) by 4.3% and that of people aged 65 years and over by 19.9%. As a result, for every person aged 65 years and over there were around three people of working age – down from nearly four people in mid-2011. This is referred to as the old-age dependency ratio.
London and the South West stand out among English regions in terms of age structure
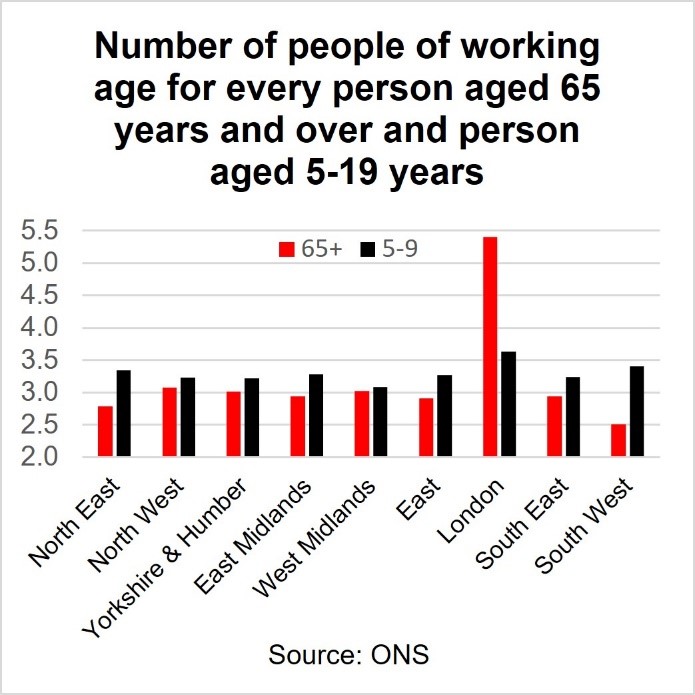
The age structure among English regions varies considerably. In terms of the old-age dependency ratio, the South West has by far the oldest population of all the English regions, with only 2½ people of working age for every person aged 65 years and over, followed by the North East at 2¾. At the other end of the spectrum is London with nearly 5½ people of working age for every person aged 65 years or over. The differences are much wider still on a more detailed geographic breakdown, with around 12 people of working age for every person aged 65 years and over in the London Borough of Tower Hamlets and less than 1½ in North Norfolk.
The picture is more similar when it comes to young people of schooling age (5 to 19 years): in every English region there are between 3 and 4 people of working age for every person of schooling age.
Total fertility rates vary widely across local authority districts and are too low to replace the population
There were 595,948 live births in England in 2021. The total fertility rate (TFR) for England was 1.62 children per women in 2021, the second lowest since the early 1940s. Westminster had the lowest TFR at 1, while Luton had the highest at 2.23. Luton was also the only local authority district in which TFR exceeded the replacement rate of 2.1 required to stabilise the population in the absence of immigration.
Similarly, age-standardised mortality rates and life expectancy vary widely
In 2021 there were 549,349 deaths from all causes in England, the second highest number since the mid-1970s because of the Covid pandemic. Age-standardised mortality rates (ASMRs), which take account of the population size and age structure of a particular location, vary widely across English regions (and males and females), with the lowest recorded in London at 906 per 100,000 people, followed by the South East (908.7) and South West (913.1). By far the highest was recorded in the North East at 1110.1.
These regional differences are also reflected in life expectancy at birth and later on in life. In the period 2012-14 (the latest available date), male life expectancy at age 65 years ranged from 17.9 years in the North East to 19.3 years in the South East and South West. Female life expectancy at age 65 years was lowest in the North East at 20 years and highest in London at 21.9 years. The differences are much more pronounced on a local authority level, with male life expectancy at age 65 years of 15.9 years in Manchester and 21.6 years in Kensington and Chelsea. Life expectancy was also lowest in Manchester for females (18.8 years) and highest in Camden (24.6 years).
London has the highest share of foreign-born residents but is losing population to other parts of England
International migration statistics are not available on a regional level. In the period July 2022 to June 2023 UK net migration (immigration minus emigration) has been provisionally estimated at 672,000, up from 607,000 in the year-earlier period, and more than twice as high as in any other respective period in previous years. Net migration of EU nationals is now negative, with the sharp jump reflecting net migration of non-EU nationals. The main reason for immigrating to the UK was work, followed by study. Current migration statistics are volatile because of global humanitarian crises.
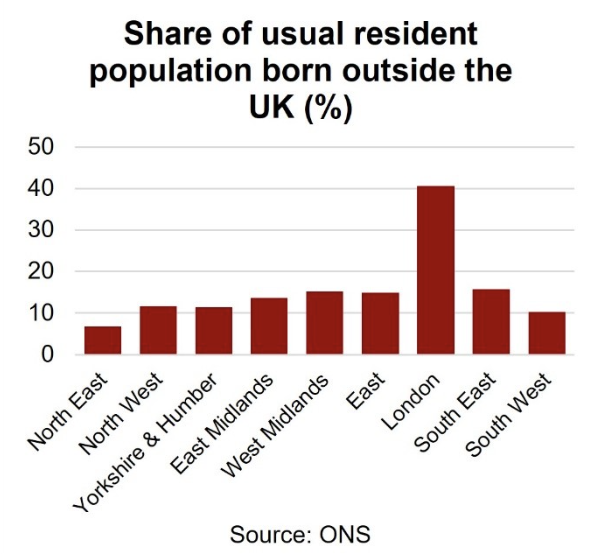
In 2021, the usual resident population in English regions was overwhelmingly born in the UK. The share of those born outside the UK in the resident population was lowest in the North East at 6.8%, followed by the South West at 10.2%. Outside London, the highest share was in the South East at 15.8%. London is the exception with a share of 40.6%.
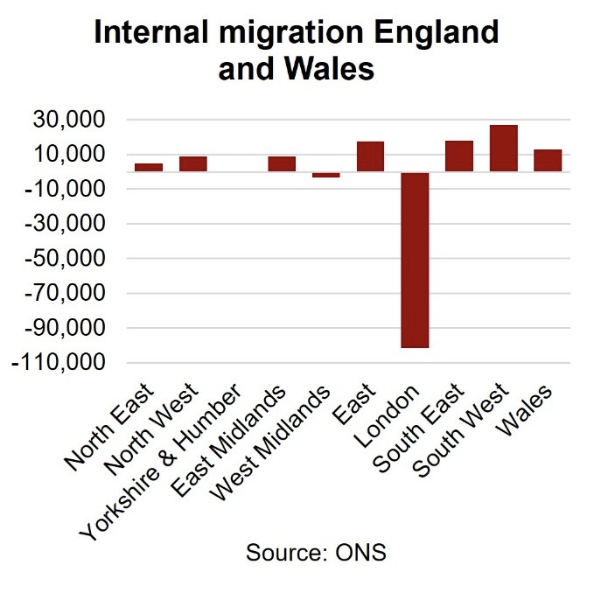
London’s unique population characteristics are also reflected in internal migration. For the year ending in June 2020 (the latest available data), London lost more than 100,000 residents to other English regions, with positive net migration only for those aged between 20 and 29 years. The pattern for London was similar in the previous year, suggesting that this significant outflow was not mainly due to the COVID-19 pandemic in 2020.
Why does it matter?
The size and composition of the UK population on the national, regional and local levels is one of the most important factors policymakers will need to consider when designing and implementing policies. It is of crucial importance for the local labour market and demand for public services at all levels of government. The UK population also differs significantly across the regions and smaller geographical units, giving rise to particular location-specific challenges and opportunities for policymakers.
If you would like to find out more about the topics discussed in this factsheet and what these might mean for your operations, please talk to us.
Suggested further reading
Population estimates for the UK: mid-2021 (Office for National Statistics)
Deaths registered in England and Wales 2021 (Office for National Statistics)
Vital Statistics in the UK: Births, Deaths and Marriages (Office for National Statistics)
Life expectancies (Office for National Statistics)
The Changing picture of long-term international migration (Office for National Statistics)
Long-term international migration Provisional Year Ending June 2023 (Office for National Statistics)
Internal migration by local authority and region (Office for National Statistics)

Key Takeaways
What is climate change?
Climate change refers to long-term changes in temperatures (i.e. global warming) and weather patterns. The earth’s climate has changed throughout history, so the phenomenon is not new. What is new is the speed and magnitude of change recorded over recent decades.
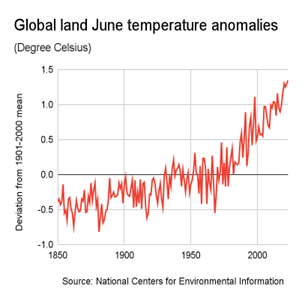
According to the United Nations (UN), the average temperature of the earth’s surface is now ~1.1°C higher than it was before the industrial revolution and the highest in the last 100,000 years. The decade between 2011 and 2020 was the warmest on record, and each of the last four decades has been warmer than any previous decade since 1850. Moreover, July 2023 was by far the hottest July on record and likely the hottest it has been in 120,000 years.
According to the UN, there is overwhelming scientific evidence that climate change over the last two centuries is man made.
How does it manifest itself?
Beyond an increasing average temperature of the earth’s surface, climate change manifests itself in many other ways. For example, over the last four decades the global mean sea surface temperature has increased by ~0.6°C – according to NASA, around 9/10th of global warming is occurring in the oceans. Increasing ocean temperatures have been linked to increasing hurricane intensity, while rising temperature levels generally have accelerated the melting of polar ice caps, resulting in rising sea levels (these have risen by more than 20 cm since 1880), and of glaciers in the mountain ranges of the world.
Changing weather patterns are also reflected in changing global patterns of precipitation, for example in less frequent but more intense rainfall, and wind patterns, both in terms of direction and speed. The impact of climate change will vary across regions or even local areas.
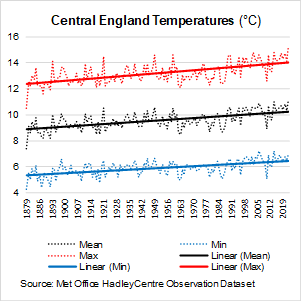
According to the Met Office climate change can also explain the rise in more intense and frequent warm spells and fall in more intense and frequent cold spells in the UK. Central England temperatures have risen markedly since records began in the 1880s. The linkage to heavy rains, dry spells and storms remains inconclusive though.
What are the consequences globally?
Consequences include:
What are the consequences in the UK?
According to the UK Government Actuary’s Department, the net effect of temperature change on excess mortality – that is the number of deaths above what would be expected under ‘normal’ conditions – so far has been negative, with lower excess deaths as a result of milder winters more than offsetting higher excess deaths as a result of hotter summers.
Why does it matter?
Climate change is one of the biggest challenges facing societies in the UK and elsewhere. Climate change has been rapid over recent decades and is, if anything, expected to accelerate in the decades ahead, with potentially significant adverse consequences for the UK. Local councils need to prepare for these inevitable changes and will need to make their contribution to slow down climate change.
If you would like to find out more about the topics discussed in this factsheet and how we might be able to help you with ESG reporting, please talk to us.
Suggested further reading
(external links, accessed 26 January 2024)
What is climate change? (United Nations)
The physical science basis (Intergovernmental Panel on Climate Change)
July 2023 hottest month ever recorded (Scientific American, July 2023)
Climate change (EU Copernicus Climate Change Service)
Global land temperature anomalies 1850- (US National Centers for Environmental Information)
Climate Change Indicators: Sea Surface Temperature (US Environmental Protection Agency)
Sea levels (US National Oceanic and Atmospheric Administration)
Ocean temperatures and hurricane intensity (University of Southampton)
Effects of Climate Change (UK Met Office)
Overall effect of temperature change on mortality (UK Government Actuary’s Department, 2023)